Thank you for attending Showcase!
Our annual report is now available online.
Design Studio
In Design Studio, we integrate agile engineering processes, lean business development, and interdisciplinary design thinking into an iterative process for problem solving and product development - our unique brand of innovation. Our iterative development methodologies lead to the development of robust software products that address real problems and provide elegant solutions. Throughout the process, Design Studio teams are mentored by industry professionals from the community, helping teams more effectively communicate, overcome technical challenges, and drive innovation for their partners.
As the capstone program in the Raikes School, Design Studio integrates concepts from our unique computer science and business curriculum, reinforcing core concepts through four semesters of hands on learning. Students gain a head start in their careers by participating in product development teams, working with real clients to understand complex business requirements, and developing innovative solutions to wicked problems. The studio model ensures that, prior to graduation, each student in the Raikes School has gained the valuable experience of participating in the full software product development life cycle - from inception of the concept to deployment for the solution.
Design Studio Annual Report

Endless Opportunity for Students

Create innovative applications and business processes to solve real-world problems

Gain valuable experience working with industry leaders in self-organizing teams

Develop a greater understanding of how business and computer science are used in companies

Work on a real software development project to develop strong project management skills prior to graduating

Form key networking contacts with top local and national companies.

Earn college credit while working with cutting edge technology to complete real software projects
Industry Partnerships
Design Studio serves as a connection point between academia and industry, creating a unique opportunity for our partners to engage some of the brightest minds on campus and leverage the value of a Big 10 research institution. Each year Design Studio engages industry partners who provide complex problems for which our student teams develop software solutions using industry best practices in software engineering and business development. This year, teams in Design Studio are completing the following projects:
| Sponsor | Project |
|---|---|
|
ALLOHelp ALLO better predict customer or potential customer behavior in order to maximize return on resource allocation while further improving upon an excellent customer experience. |

|
AllstateBuild a dashboard to monitor millions of computer vision model predictions that are disrupting the insurance industry! |
|
BuckleHelp Teammates and Guests discover the right product while improving the shopping experience through the user of visual search to find similar products. |
|
Cattle KettleSmart Solutions for Livestock Ranchers - A tech-driven approach to optimize water management and enhance cattle health. |
|
City of LincolnAn opportunity to create a user-friendly landing page for those visiting the city of Lincoln was well as creating a specialized permitting application for the City Clerk's office. |
|
DMSiSoftware provider DMSi needs an AI Research Tool/Chatbot (à la ChatGPT), including natural language processing, AI/ML configuration, and UI development. |
|
DyslexicoMake writing more accessible for people with dyslexia by providing AI-powered spelling and grammar tools tailored to the dyslexic mind. |

|
Farm Credit Services of AmericaMachinery Match - Your Ultimate Farm Equipment Guide |
|
First National Bank of OmahaScams never sleep. Are your finances FraudSmart? |

|
HudlMake Hudl a must have tool for field hockey teams around the world. |
|
INFRWeb app that allows users to upload a directory of images and automatically rename, sort, and tag the images, based on a user defined pattern and AI-identified elements in the image. |
|
KiewitKiewit wants to collect and visualize empirical fuel consumption data from its equipment to improve project cost management, equipment maintenance planning, and emissions reporting accuracy. |

|
Medical SolutionsAn AI Assistant for Clinicians to increase workplace happiness and patient care. |
|
MICAH House (sponsored by Spreetail Foundation)MICAH House seeks a software solution that can accurately track individual donor donation totals; print, email or text receipts; and to pull reports of the data. |

|
Mutual of OmahaBuild a modern Frontend Web application utilizing industry leading technologies for the Mutual of Omaha Insurance Company. |
|
NelnetDevelop a new way for companies and job-seekers to connect with each other in a much more efficient manner that will begin the disruption of how both parties are able to identify and connect. |
|
Nebraska School Activities AssociationRevamp the system that tracks and maintains information on officials that function as independent contractors for us. |

|
OlssonProject ZeroDelta II connects the designed world to the real world. |
|
ScoularDevelop a Scoular Feed Marketplace to provide customers with a digital platform to interface with Scoular from Quote to Contract to Final Delivery. |
|
Signature PerformanceHealthcare interoperability engine build to enable automation resulting in reduced administrative cost and burden while driving better patient outcomes. |
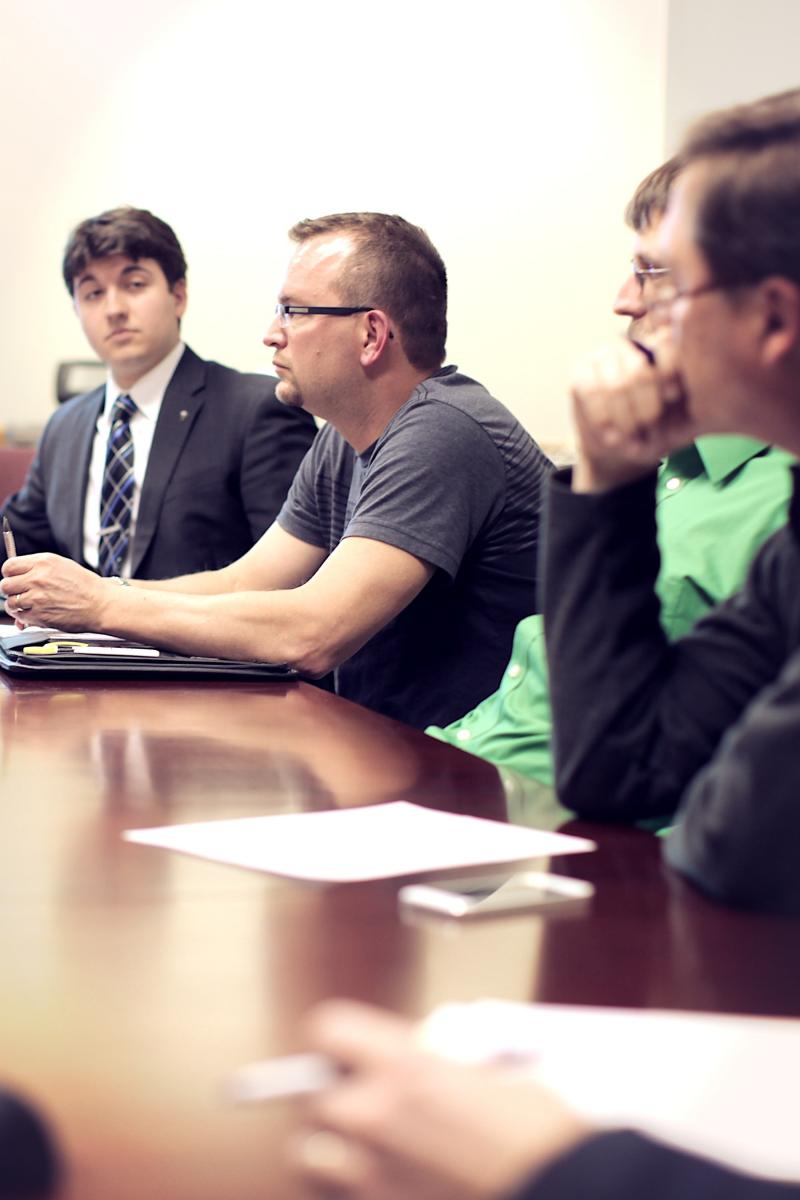
Industry Collaboration
Students in Design Studio learn not only from top practitioner faculty, but also from industry leading experts. Whether it is a local software executive who gives a guest lecture on enterprise architecture or a CEO who coaches a Design Studio team, students regularly interact with and learn from top industry professionals. Regular collaboration between faculty, students, and industry partners creates an ecosystem unique to Design Studio that drives innovation at all levels. Through that collaboration, students and their teams are making big things happen every day.
Students in Design Studio not only learn from industry leaders, they innovate with them. Every year our students are developing new concepts, sharing creative ideas, enriching our partner organizations, and becoming members of their team.